Evaluating the Graphic Vector Map of United States for Professional Design Projects
Selecting the right cartographic asset is a foundational step in data visualization, editorial design, and corporate reporting. When sourcing a Graphic Vector Map of United States, professionals must look beyond simple aesthetics to evaluate technical compatibility, editability, and long-term utility. Unlike raster images that degrade when resized, vector-based maps offer mathematical precision that allows for infinite scaling without loss of quality. This distinction is critical for designers working across multiple mediums, from business cards to large-format trade show banners. Understanding the specific file formats included in this package—AI, EPS 10, PDF, SVG, and PNG—is essential for determining whether this resource aligns with your current workflow and software ecosystem.
Vector Versus Raster: Technical Implications for US Cartography
The primary advantage of utilizing a Graphic Vector Map of United States lies in its resolution independence. Raster formats, such as standard JPEGs or non-transparent PNGs found on general stock sites, are composed of a fixed grid of pixels. When these are enlarged beyond their native dimensions, they become pixelated and unprofessional. In contrast, vector graphics use paths, points, and curves defined by mathematical equations. This means that whether you are displaying the map on a mobile screen or printing it on a billboard, the edges remain crisp and the colors stay consistent.
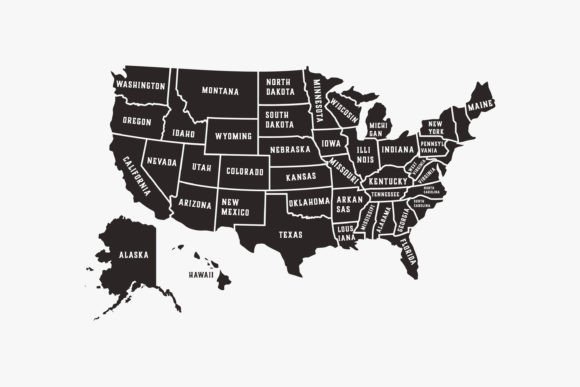
For projects involving United States geography, this scalability is particularly important due to the complexity of state borders and coastlines. A low-resolution raster map often suffers from jagged edges along intricate boundaries like those of Maine, Florida, or Alaska. The vector format preserves these details perfectly at any zoom level. Furthermore, vector files typically have smaller file sizes than high-resolution rasters, making them easier to store, share, and embed within larger layout documents without bloating project files.
Format Compatibility and Workflow Integration
This specific map package includes six distinct file types, each serving a unique purpose in a professional pipeline. Understanding when to use which file can save significant production time.
- AI (Adobe Illustrator): This is the native source file for users within the Adobe ecosystem. It retains all layer information, editable anchor points, and color profiles. It is the best choice for deep customization, such as redrawing borders or integrating complex infographics directly into the map geometry.
- EPS 10: Encapsulated PostScript version 10 is the industry standard for cross-platform vector exchange. If you use CorelDRAW, Affinity Designer, or older versions of Illustrator, EPS 10 provides the highest level of compatibility while maintaining full vector editability. It is generally safer than AI files for sharing between different software environments.
- PDF (Portable Document Format): While often associated with document viewing, vector PDFs are fully editable in most vector design applications. This format is ideal for clients or stakeholders who need to view the map accurately without owning design software, yet still require a file that can be modified later by a designer.
- SVG (Scalable Vector Graphics): This XML-based format is essential for web and interactive design. Unlike AI or EPS, SVG code can be manipulated via CSS and JavaScript. If your Graphic Vector Map of United States is intended for a responsive website, dashboard, or interactive presentation, SVG is the required format. It ensures sharp rendering on Retina displays and high-DPI screens.
- PNG (Transparent Background): This package includes a PNG specifically noted as having a transparent background without text. This is a crucial variation for quick compositing. Because the text is removed, designers can overlay their own typography or data labels without needing to delete existing elements. However, unlike the other five files, this PNG is raster-based and non-editable as a vector.
- JPG Preview: Included solely for reference, this file helps identify the correct asset in your library but should never be used in final production work.
Editability Tradeoffs: Text Handling and Customization Limits
A defining characteristic of this product is the note regarding "non-editable text." For many designers, this requires a shift in workflow compared to maps where state names are live type. When text is outlined or flattened, it becomes a shape rather than a font. This has both benefits and limitations that must be weighed during the evaluation process.
The benefit of non-editable text is consistency. You do not need to worry about missing fonts, licensing issues, or text reflowing unexpectedly when opening the file on a different machine. The map will look exactly as intended regardless of the environment. For projects requiring a clean, minimalist aesthetic where the map serves as a background element or a subtle geographic reference, pre-styled text eliminates the need for typographic decisions.
However, the limitation is significant if your project requires updating labels. If you need to change "California" to "CA," or update population figures embedded in the map, you cannot simply highlight and retype. You would need to manually erase the existing vector shapes and add new text layers. For data-heavy projects or maps requiring frequent updates, this friction may make this specific Graphic Vector Map of United States less suitable than alternatives with live text layers. Conversely, if you plan to remove all labels entirely to create a choropleth or heat map, the non-editable nature is irrelevant, provided you can easily select and delete the text group.
The Strategic Value of the Textless Transparent PNG
The inclusion of a transparent PNG without text addresses the editability limitation for specific use cases. This file acts as a ready-made base layer for designers who want total control over labeling but do not need vector editing capabilities for the landmass itself. This is particularly useful for PowerPoint presentations, Keynote decks, or quick social media graphics where opening Illustrator is unnecessary overhead. By providing this specific variation, the package bridges the gap between professional vector workflows and rapid content creation, offering versatility that single-format products lack.
Comparing Alternatives and Decision Factors
When evaluating this Graphic Vector Map of United States against other market options, several decision factors emerge. Free open-source maps, such as those from government repositories or Wikimedia, often provide raw geographic data but lack design refinement. They may include unnecessary administrative lines, inconsistent stroke weights, or unoptimized node counts that slow down performance. This commercial asset is curated for visual balance, meaning the projection, spacing, and line weights have been adjusted for graphic design rather than strict geospatial accuracy.
On the other end of the spectrum are specialized mapping plugins and GIS-integrated tools. These are superior for accurate data visualization where geographic precision is paramount. If your project involves plotting thousands of data points based on latitude and longitude, a static vector map is insufficient. However, for conceptual illustrations, regional sales territories, travel logistics, or branding materials where approximate geography suffices, the static vector approach is faster and more aesthetically controllable.
Another comparison point is bundled versus individual assets. Some resources sell US maps only as part of massive world map collections. While comprehensive, these bundles often contain outdated projections or inconsistent styling across regions. A dedicated Graphic Vector Map of United States typically offers better optimization for domestic projects, ensuring that Alaska and Hawaii are positioned proportionally for layout purposes rather than strict geographic reality, which is a common requirement in American graphic design.
Best-Fit Scenarios and Limitations
This vector map package is ideally suited for marketing collateral, annual reports, educational materials, and web interfaces where visual clarity trumps geospatial precision. The multi-format delivery ensures that a single purchase covers print, digital, and presentation needs. The EPS 10 and AI files serve agencies and print shops, while the SVG supports modern web development teams.
It may not be the right choice if you require dynamic data binding, real-time interactivity, or frequently changing textual content. Additionally, if your project demands topographical detail, county-level granularity, or census-tract accuracy, this generalized graphic map will fall short. Users should also verify that the specific artistic style matches their brand guidelines; vector maps vary significantly in terms of border thickness, corner radius, and overall weight. Since the text is non-editable, the visual tone is somewhat fixed unless you are comfortable reconstructing label systems from scratch.
Ultimately, the value of this Graphic Vector Map of United States lies in its production readiness. It solves the immediate problem of needing a scalable, multi-format US map while providing specific variations like the textless PNG to handle common edge cases. By understanding the implications of the file formats and the tradeoffs of non-editable text, professionals can confidently integrate this asset into their workflow, avoiding the pitfalls of incompatible files or unsuitable levels of detail.